October 14, 2026
Drone Field Mapping vs Satellite Imagery
Satellite imagery is free, covers every acre you farm, and arrives without anyone driving anywhere. A drone flight costs money, covers one field at a time, and has to be booked. Most farms should be using both, because they answer different questions, and the honest split is clearer than the marketing on either side suggests.
What It Is
Two ways of looking at a crop from above, separated by about four hundred kilometres of altitude and by what that altitude does to a pixel.
Satellite imagery comes from sensors in orbit that photograph the whole landscape on a fixed schedule whether you asked for it or not. The two public workhorses are the European Copernicus programme's Sentinel-2 pair and the USGS and NASA Landsat series. Both are free to anyone, both have been running long enough to form a genuine archive, and both deliver the near-infrared bands that make a vigour index possible. Commercial constellations sit alongside them selling finer pixels and more frequent passes.
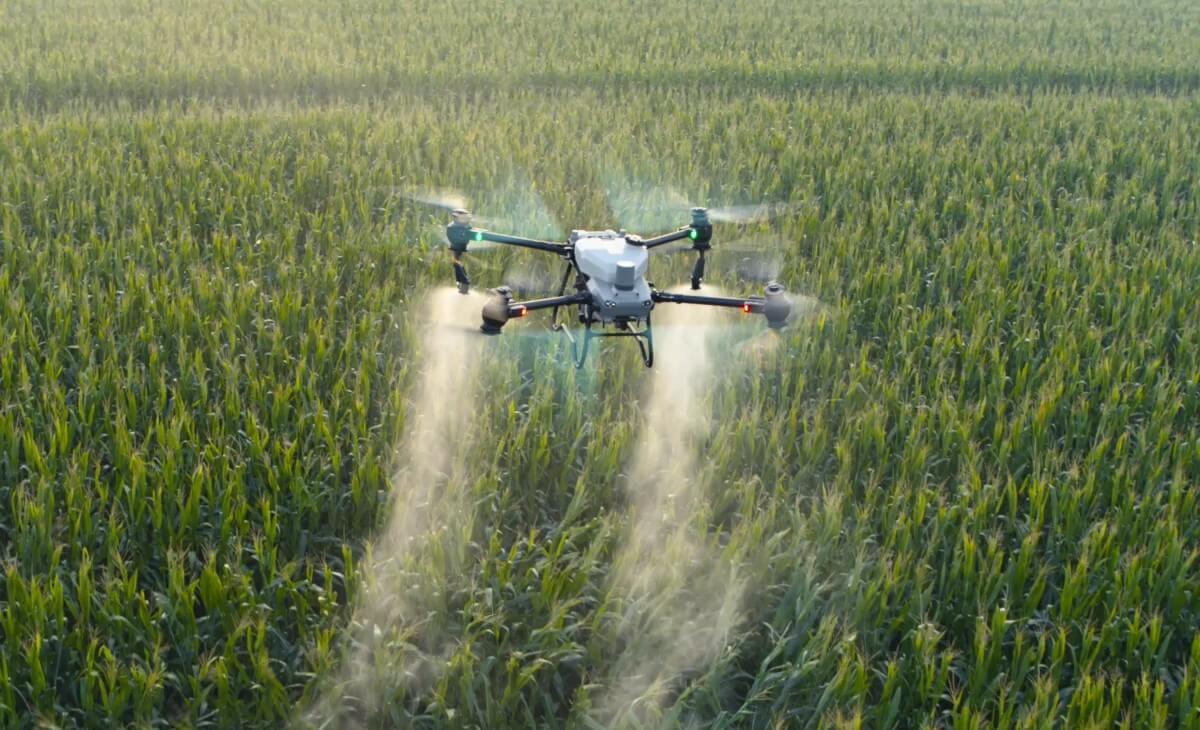
Drone field mapping is the opposite arrangement. A sensor is flown a few hundred feet over one field, on a day you chose, in a grid pattern, and the overlapping photos are processed into a georeferenced orthomosaic measured in centimetres per pixel rather than metres.
The two are not competing for the same job, and treating them as rivals is how farms end up paying for the wrong one. Satellite is a monitoring system. A drone is an instrument. The first tells you where to look, and the second tells you what you are looking at.
Who It's For
Anyone who has been told that satellite imagery makes drones pointless, or that drone imagery makes satellite imagery a toy. Both claims are sold confidently and both are wrong.
It matters most to operations making one of three decisions. Whether to pay for a drone mapping flight when a free satellite image of the same field is already available. Whether a prescription built from satellite data is good enough to apply against. And whether an insurance, program, or landlord conversation can rest on an image from orbit.
It also matters if your fields are the broken parkland kind. The finer the real pattern in a field, the worse a coarse pixel describes it, and central Alberta quarters cut up by sloughs, bush margins, and eroded knolls are exactly where that gap opens up.
If the question is drone imagery versus boots in the crop rather than versus orbit, that is a different comparison and the scouting article covers it.
How It Works
Resolution is the whole argument, and it is not about sharpness. Sentinel-2 delivers its visible and near-infrared bands at ten metres per pixel. Landsat works at thirty. A drone mapping flight works in centimetres, set by the camera and the height flown, which is what ground sample distance describes.
Those numbers only become meaningful when you convert them into ground. A ten-metre pixel covers a hundred square metres, which is roughly a fortieth of an acre. A thirty-metre Landsat pixel covers nine hundred square metres, which is about two tenths of an acre. So a Landsat pixel is not a dot on a map; it is a patch of crop the size of a small yard, reported as one single value.
The mixed pixel is the consequence, and it is the part nobody mentions. A pixel reports one number for everything inside it. When the ground inside it is uniform crop, that number is honest. When the pixel straddles a crop edge, a slough margin, a grassed waterway, a field road, or a shelterbelt shadow, the number it reports is an average of things that have nothing to do with each other, and no amount of processing recovers the parts.
On a square half section of even wheat this barely matters, because most pixels are fully inside the crop. On a quarter with four sloughs, a creek crossing, bush on two sides, and a yard site, a large share of the pixels are mixed, and the edges of every real feature are blurred outward by a full pixel in each direction. That is why a satellite NDVI map of parkland ground so often looks plausible and vague at the same time.
What each one can actually measure. This is the cleanest way to separate them.
Satellite imagery is excellent at relative change over a large area. Which of my twenty fields is behind. Whether that field is behind this week compared with last week. Whether this year looks like the last five. Those are comparisons of a whole field against itself or against its neighbours, and a coarse pixel answers them well because the signal is bigger than the pixel.
A drone map is what you use when the answer has to have a boundary and a number. The extent of a drowned-out area in acres. The shape of a thin patch you intend to treat differently. A farmed field boundary traced to the real edge rather than the title line. A hail-damaged zone described to an adjuster. Those answers need an orthomosaic you can measure on, and they need the edges to be where the edges are.
Revisit interval versus flying on demand. The Sentinel-2 pair passes over any given spot roughly every five days. Landsat comes back about every sixteen. That cadence is genuinely valuable, because it accumulates without anyone doing anything, and a season of it is a record you did not have to plan for.
A drone has no cadence at all. It flies when you send it, which is the point. The two properties trade off directly: satellite gives you dates you did not choose, and a drone gives you the one date that mattered, which is usually the day after the storm or the day before the sprayer goes.
Cloud is where the schedule stops being a schedule. A revisit interval is a promise about where the satellite will be, not about whether it will see anything. An optical sensor in orbit looks through the entire atmosphere, so a pass under cloud returns cloud, and a pass under thin haze returns numbers that are quietly wrong rather than obviously missing.
This is not a minor caveat in an Alberta growing season. Stretches of unsettled weather are common exactly when a crop is changing fastest, and the five-day interval can become three weeks of nothing usable. The weeks you most want imagery, during a wet stretch or in the days after a storm system, are the weeks least likely to produce a clear pass.
A drone flies underneath all of it. Overcast is usually the better light for mapping anyway, because it removes hard shadow. Wind and rain stop a flight; cloud does not.
Turnaround, stated fairly for both. Free satellite imagery is quick to reach if you use a platform that ingests it for you, and slower if you are pulling and processing scenes yourself. A drone job has a different shape: the flight is short, and the time is in travel, flying, processing, and delivery. Neither is instant, and anyone promising same-hour answers from either should be asked how.
Elevation is the gap people are most surprised by. Satellite imagery is imagery. Drainage and tile work need the height of the ground, which is a different product entirely, and the distinction between a surface model and a terrain model is the thing that decides whether elevation data is usable for design. Public satellite elevation data exists at coarse scales and is nowhere near what a tile plan needs. That is why drone elevation mapping is a flight and not a download.
Prescriptions, and the honest version of this. A satellite NDVI series is a reasonable input to zone building, particularly across several years, because stable patterns that repeat season after season are exactly what a zone should be built on. It is coarse, but a zone is a coarse thing too.
Where it falls down is resolution of the zone boundary and the ability to catch something fine. A ten-metre grid cannot describe a two-metre saline edge or a narrow eroded knoll, and a prescription whose zones are drawn from blurred edges applies the wrong rate along every one of those edges. Zones built for variable-rate granular also need ground truth either way: imagery of any kind shows vigour, not nutrient status, and zone soil sampling is the step in the middle that neither sensor replaces.
Positional accuracy. A satellite scene arrives georeferenced to the provider's standard, which is consistent and fine for comparing scenes against each other. A drone map's accuracy depends on how it was flown, which means RTK positioning and, where the work has to tie to a benchmark or a contractor's grade control, surveyed ground control points. The practical point is that a drone map can be far more accurate than a satellite scene, and can also be worse if nobody controlled it, so it is a question to ask rather than an assumption to make.
Archive depth. Satellite wins this outright and it is worth saying plainly. There is no way to fly a drone over your field in 2019 retroactively. If the question is how a field has behaved over a decade, the free archive is the only answer that exists, and it is a good one.
The decision table
| If this is the question | The better tool |
|---|---|
| Which of my fields needs attention this week | Satellite |
| How has this field behaved over several seasons | Satellite |
| Is the whole farm ahead or behind compared with last year | Satellite |
| Finding stable multi-year patterns to build zones on | Satellite |
| What exactly is wrong in that patch, and where does it start | Drone |
| How many acres are affected, as a number I can defend | Drone |
| Documenting hail, frost, or flood extent for an adjuster | Drone |
| A field boundary traced to the farmed edge | Drone |
| Imagery during a cloudy stretch, or the day after a storm | Drone |
| Elevation data for drainage or tile design | Drone |
| Fine zone boundaries on broken parkland ground | Drone |
| Narrow features: saline edges, eroded knolls, thin strips | Drone |
On cost. The site publishes two figures and neither is a satellite comparison: an Alberta custom application range of roughly 10 to 15 dollars per acre, and a drone operating cost of about 4.50 dollars per acre in the ROI calculator. Those describe application work, not mapping, and quoting them here would be dishonest.
The useful observation about cost is structural. Public satellite imagery is free, so the comparison is never free against paid; it is free-and-coarse against paid-and-precise. The question that follows is not which costs less. It is whether the decision in front of you is worth resolving properly. Choosing which quarter to walk first does not need a flight. Telling an adjuster how many acres drowned out, or building a prescription you will apply product against, generally does.
Key Dates
- Sentinel-2 resolution:10 m per pixel, visible and near-infrared bands
- Landsat resolution:30 m per pixel, about two tenths of an acre each
- Drone mapping resolution:Centimetres per pixel, set by camera and height
- Satellite revisit:About 5 days Sentinel-2, about 16 days Landsat, cloud permitting
- Drone revisit:The day you choose, underneath the cloud
- Elevation for drainage:Drone flight, not a satellite download
How UAV AG Can Help
How UAV AG handles this when you call about mapping:
- →We will tell you when free satellite imagery already answers your question, and point you at it rather than selling a flight.
- →We scope mapping work by what has to be measured, not by acres, because that is what decides whether resolution matters.
- →Flights are flown and positioned for the job, with ground control added when the result has to tie to a benchmark or a contractor grade.
- →Deliverables are named before the flight: orthomosaic, index layers, elevation products, boundary files, and the format each arrives in.
- →On zone work we say plainly that imagery shows vigour and not nutrient status, and that zone soil sampling is the step in between.
- →Where a satellite series is the better base for multi-year zones, we will say so and use it.
- →Current SFOC, RPAS pilot certification, and liability insurance available to view on request.
A Note From Us
The version of this argument sold hardest is that one of these makes the other obsolete, and it has been sold in both directions for a decade now.
What has actually happened is that free satellite imagery got good enough to make whole-farm monitoring routine, which was genuinely a shift, and that drone mapping stopped being about pretty pictures and became about measurement. Those two developments pushed the tools further apart rather than closer together.
The plainest way to hold it: satellite imagery is a smoke alarm and a drone map is an inspection. A smoke alarm that goes off every five days for nothing would be useless, and an inspection you ran every five days on every room would be unaffordable. You want the cheap wide signal running constantly and the expensive precise instrument pointed only where the signal says to point it.
The farms that get the most out of either are the ones that stopped asking which to buy. They watch everything from orbit for nothing, and they fly the two or three fields a year where a real number has to come out: the drowned acres, the hail quarter, the field going into a new prescription, the ground a tile contractor needs a grade for.
If you are already using a satellite platform and it is working, keep it. Tell us what it showed you and which field you could not resolve, and that is the flight worth booking.
Frequently asked questions
Is satellite imagery good enough to replace drone mapping?
For whole-farm monitoring, often yes, and it is free, which makes it hard to argue against. For anything that needs a boundary or an acre count, no. Sentinel-2 works at ten metres per pixel and Landsat at thirty, so each pixel is a patch of crop between roughly a fortieth and two tenths of an acre reported as one value. That is enough to tell you a field is behind and not enough to tell you how many acres are affected or where the problem starts.
What is a mixed pixel and why does it matter on my fields?
A pixel reports a single number for everything inside it, so when it straddles a crop edge, a slough margin, a grassed waterway, a field road, or a shelterbelt shadow, that number is an average of unrelated ground and the parts cannot be recovered. On open square acres almost every pixel sits fully inside the crop and this barely matters. On broken central Alberta quarters a large share of pixels are mixed and the edges of every real feature are blurred outward, which is why satellite maps of parkland ground look plausible and vague simultaneously.
How often does satellite imagery of my field get taken?
The Sentinel-2 pair passes over any given location roughly every five days and Landsat about every sixteen, and both are free. The important caveat is that a revisit interval is a promise about where the satellite will be rather than whether it will see anything, because an optical sensor looks through the whole atmosphere. Cloud returns cloud, and haze returns numbers that are wrong without looking missing.
Can a drone fly when it is cloudy and a satellite cannot see?
Yes, and in an Alberta season that is one of the strongest practical arguments for a flight. A drone works a few hundred feet up, underneath the cloud deck entirely, and overcast is often better mapping light because it removes hard shadow. Wind and rain stop a flight, but cloud does not, and the weeks you most want imagery during a wet stretch or after a storm system are the weeks least likely to give a clear satellite pass.
Can I build a variable-rate prescription from satellite imagery?
You can, and a multi-year satellite series is a reasonable base for zones because the patterns that repeat season after season are exactly what a zone should rest on. The limits are the zone boundary and anything narrow: a ten-metre grid cannot describe a two-metre saline edge or a thin eroded knoll, so a prescription drawn from blurred edges applies the wrong rate along every edge. Either way, imagery shows vigour and not nutrient status, so zone soil sampling remains the step in between.
Which one do I use for a hail, frost, or flood claim?
A drone flight, because a claim conversation needs extent and position rather than an impression. Damaged or drowned-out area traced and measured on a centimetre-scale georeferenced orthomosaic produces a figure someone else can check, flown on the date you chose rather than whenever the next clear pass happens to fall. A coarse satellite scene from an uncertain date is not a strong document for that conversation.
Can satellites give me elevation data for tile drainage?
Not at a resolution that is any use for design. Drainage and tile work depend on the height of the ground rather than a picture of it, and the public satellite elevation data that exists is far too coarse for that. The relevant distinction is between a surface model, which includes crop, bush, and buildings, and a bare-ground terrain model, which is what a drainage design is built against, so this is a flight rather than a download.
Is satellite imagery really free?
The Copernicus Sentinel-2 data and the USGS and NASA Landsat archive are both free to anyone, and that is one of the genuinely good things about modern farming data. What is often being paid for is the platform that ingests, processes, and presents it for you, which is a convenience charge rather than an imagery charge. Commercial constellations selling finer pixels or more frequent passes are a separate paid product.
Does a drone have any advantage over satellite in the archive?
No, and this is the one place satellite wins outright. There is no way to fly a drone over your field retroactively, so if the question is how a quarter has behaved over the last decade, the free satellite archive is the only answer that exists. It is also a good one, because a long consistent record of relative change is exactly the comparison a coarse pixel handles well.
Should I pick one or use both?
Both, and the split is clean enough to set up once and leave alone. Run the free satellite series as the standing whole-farm screen that accumulates without anyone planning it, then fly the two or three fields a season where a real number has to come out: the drowned acres, the hail quarter, the field going into a new prescription, or ground a tile contractor needs a grade for. The satellite trend is what tells you which fields those are.