Crop Monitoring
Catch problems early with regular multispectral surveys — before they become yield losses.
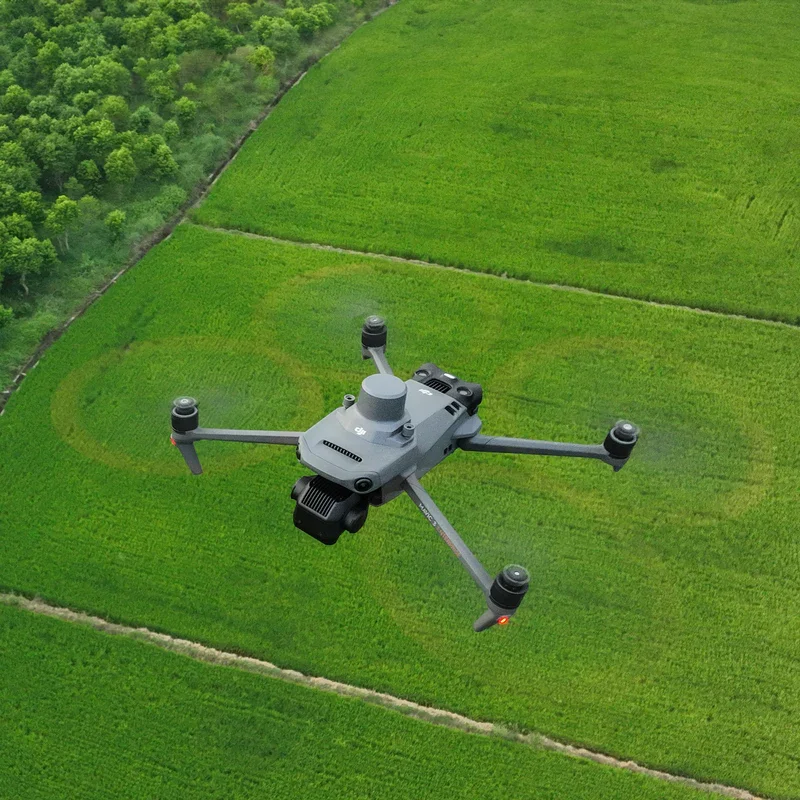
See What Your Eyes Can't
Regular multispectral surveys throughout the growing season give you a complete picture of crop health, stress, and development. Catch problems early — before they become yield losses.
Our 5-band multispectral cameras capture light beyond what the human eye can see, revealing early signs of nutrient deficiency, disease pressure, and water stress days or even weeks before symptoms are visible from the ground. This early detection allows you to take targeted action — applying fungicide only where disease is starting, or sending a scout to investigate a stress zone rather than walking the entire field.
We offer season-long monitoring programs that track crop development from emergence through harvest, giving you and your agronomist a timeline of crop performance across every acre. NDVI maps and stand count data are delivered digitally and can be imported directly into your farm management software for record-keeping and decision support.
Key Benefits
Suitable Crops
Related Services
Further reading: Identifying canola diseases early with drone NDVI.
Frequently asked questions
What is NDVI and what does it show?
NDVI (Normalized Difference Vegetation Index) is a ratio of near-infrared to red light reflected by the canopy. Higher values mean healthier, denser vegetation. It maps crop vigour, stress, and uneven stands at sub-metre resolution.
How often should I fly a field for crop monitoring?
Best practice is 4-6 flights per season at key growth stages: post-emergence, tillering, flag-leaf, early flower, and mid-grain-fill. UAV AG offers a flat-rate seasonal package covering these flights.
Can NDVI identify weeds or disease?
Indirectly - it shows where canopy vigour drops. Combining NDVI with the visible RGB image and a follow-up ground scout lets you separate weeds from disease, drought stress, or nutrient deficiency.
Do you provide variable-rate prescription maps from the survey?
Yes. For an additional fee, UAV AG processes the NDVI into a prescription map for variable-rate top-dress or fungicide application, in the format your sprayer or our drone can read.
How does drone crop monitoring compare to satellite imagery?
Drone surveys deliver 2-10 cm/pixel resolution under your control of timing and cloud conditions. Satellites give 3-30 m/pixel and depend on cloud-free passes. Drones win on resolution and timing; satellites win on cost for thousands of acres.
Start Monitoring Your Crops Today
Get ahead of crop problems with regular multispectral surveys. Contact us for a season-long monitoring quote.
Request a Quote