September 16, 2026
Drone Multispectral Scouting vs Walking the Field
One method finds the pattern and the extent across every acre. The other finds the cause, at the plant. An honest decision comparison for Central Alberta, including why neither one replaces the other.
What It Is
There are two ways to find out what is happening in a crop: fly it and look at a map, or walk it and look at plants.
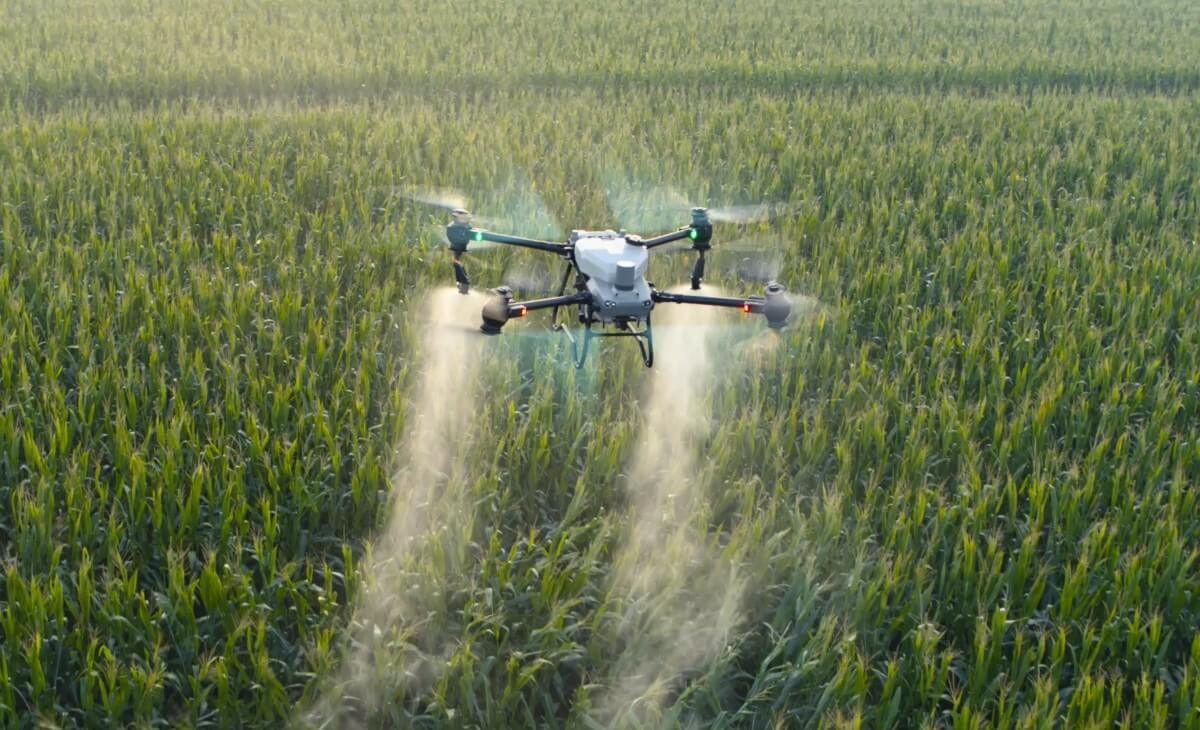
Multispectral drone scouting flies the field on a grid at mapping height and records reflectance in bands the eye cannot see, including near infrared. Those bands become an index map, most commonly NDVI, that shades the field by canopy vigour. What comes back is the whole quarter at once, with the parts performing differently from their neighbours showing up as shapes.
Walking the field is exactly what it sounds like. Boots in the crop, plants pulled, leaves turned over, roots dug, counts taken.
They are not the same job. A map tells you where and how much. A plant in your hand tells you what and why. This comparison is about which method answers which question, and about the fact that a scouting program running only one of them is leaving something on the table.
Who It's For
Central Alberta grain, oilseed, and pulse growers who are already scouting and are deciding whether imagery earns a place in the program, and agronomists covering more acres than the season has days for.
It is also for the grower who tried an NDVI map once, found it showed a wet spot everybody already knew about, and concluded imagery was a gimmick. That outcome usually comes from flying once, late, with nothing to compare against and nobody walking the flagged areas afterward. The comparison below is honest about where that criticism lands and where it does not.
How It Works
Here is the honest head-to-head on the factors that actually decide it:
| Factor | Multispectral drone scouting | Walking the field |
|---|---|---|
| Coverage | The whole quarter, every acre, in one flight | Whatever a person can cover on foot |
| What it finds | Pattern, extent, and the boundaries of a problem | Cause, identity, and severity at the plant |
| Sampling bias | None: it does not skip the far corner | High: people walk the accessible parts |
| Timing | Earlier, once stress shifts how the canopy reflects | When symptoms are visible to the eye |
| Diagnosis | No: an index shows vigour, never a reason | Yes: this is the only method that identifies |
| Below the canopy | Sees the canopy surface only | Sees stems, lower leaves, and roots |
| Insect and plant counts | Not directly | Yes |
| Repeatability | High: same plan and height, comparable maps | Varies with who walked and where they went |
| Output | A georeferenced map that feeds zones and prescriptions | Notes, photos, and a decision |
| What stops it | Needs a flyable window and consistent light | Needs ground you can walk and time to walk it |
What the map is genuinely better at. Two things, and both are significant.
The first is extent. Standing in a bad patch tells you the patch is bad. It does not tell you whether it covers two acres or forty, whether it stops at an old fence line, or whether three more like it are sitting in the part of the quarter nobody has walked since seeding. A map answers all of that in a single pass, and extent is usually what decides whether a problem is worth spending money on.
The second is the absence of sampling bias. Scouting on foot is honest work, but it follows the approach, the tramlines, and the parts of a field a person can reasonably reach. The far corner past the slough gets walked least, which is exactly where something can sit unnoticed for weeks. The aircraft has no preference about which acre it flies over.
There is a third advantage, and it is conditional: timing. Plant stress changes how a canopy reflects near infrared before it changes how the crop looks, which is why staged multispectral scouting can flag trouble weeks before visual symptoms appear. That head start is real, but it only converts into a decision if somebody goes and looks.
What walking is better at, and what the map cannot do at all. Diagnosis, and the map cannot do it at any price.
An index map shades a patch as low vigour. Low vigour is what drowning looks like. It is also what root rot looks like, and thin stand, and a nutrient shortage, and an old corral site, and a sprayer miss, and a hail streak, and gopher damage. The map cannot separate those, and no amount of processing will make it, because the sensor is measuring the effect and every one of those causes produces the same effect.
Walking also sees what the canopy hides. Disease commonly starts on lower leaves and in stems. Roots have to be dug. Insect counts have to be taken by hand. Nodulation has to be checked by pulling a plant. A sensor above the crop sees the top of the canopy, and by the time a problem in the understory is visible from above, it has been developing for a while.
How they actually work together. The productive pattern is not choosing between them. It is flying first and walking second, with the map deciding where the boots go.
- Fly the field and produce the index map.
- Read it for pattern rather than for absolute values. Shape carries most of the information: a straight edge suggests equipment or an old boundary, a low-lying blob suggests water, a diffuse patch bleeding into good crop suggests something biological.
- Pick the ground-truth points off the map, deliberately including a strong area as a reference instead of only the worst spots.
- Walk those points and diagnose. This is the step that produces the answer, and it is the step that gets skipped.
- Record what the ground truth turned out to be, so the next map of the same field can be read faster and with more confidence.
That sequence turns half a day of walking into a targeted hour, and it turns a map from a picture into a decision.
Key Dates
- Best use of a map:Pattern and extent across a whole quarter
- Best use of boots:Identifying the cause at the plant
- Working order:Fly first, then walk the points the map picks
- What NDVI measures:Canopy vigour, not nutrient need
- Where it leads next:Zones and prescriptions once ground-truthed
How UAV AG Can Help
How UAV AG fits into a scouting program that already works:
- →Multispectral flights flown to a repeatable plan and height, so this week’s map can be fairly compared against the last one instead of against a differently flown one.
- →Georeferenced index maps in formats you can open in the field on a phone or tablet, with the weak areas pinned so they can be navigated to rather than hunted for.
- →A read of the map for pattern and shape, including which anomalies look like equipment passes or old field history rather than agronomy.
- →Straight talk that the map diagnoses nothing. We will tell you where to walk. What you find when you get there is agronomy, not imagery.
- →Repeat flights through the season where the value is in the change between dates, and a single flight where it is not.
- →Zone and prescription work downstream, once there is ground truth to justify building zones on.
A Note From Us
Neither method wins this comparison. The claim that imagery replaces scouting is a sales pitch, and the claim that imagery is a gimmick usually traces back to one flight, flown late, with nobody walking the spots it flagged.
What imagery replaces is the guessing about where to walk. It covers the acres a person will not, removes the bias in which parts of a field get looked at, and puts an extent on a problem so the decision about spending money on it has a number behind it. Then somebody still has to pull a plant, because that is the only way anyone finds out what is actually wrong.
If your scouting program is already tight and the binding constraint is days rather than diagnosis, imagery buys the days back. If nobody is walking fields at all, a map will not fix that, and flying one first is the wrong order of operations.
For the disease side of this, see identifying canola disease from drone NDVI. For where maps lead once ground truth exists, see prescription maps and our crop monitoring service.
Frequently asked questions
Does drone scouting replace walking the field?
No, and any claim that it does is a sales pitch. A multispectral map shows where the crop is performing differently and how much ground that covers. It cannot tell you why, because every cause of poor vigour produces the same signal. The map decides where you walk; walking decides what you do.
What can an NDVI map actually tell me?
Pattern, extent, and relative vigour across the whole field. It shows you the shape and size of an area that is underperforming its neighbours, including areas in parts of the quarter nobody has walked recently. It measures canopy vigour, not nutrient need and not a diagnosis, which is why it is the starting point of a scouting trip rather than the end of one.
Why does a low NDVI area still need to be walked?
Because low vigour is the shared symptom of a long list of unrelated causes: excess water, root rot, thin stand, a nutrient shortage, an old corral site, a sprayer miss, hail, gopher damage. The sensor measures the effect. Only a plant in your hand separates the causes, and the treatment for each of them is different.
Can a drone find problems before I can see them?
Often, yes. Plant stress changes how a canopy reflects near infrared before it changes how the crop looks to the eye, which is why staged multispectral scouting can surface trouble weeks ahead of visual symptoms. The head start only pays off if somebody walks the flagged area while there is still time to act on it.
What does walking the field catch that a drone map misses?
Everything below the canopy surface and everything that needs identification. Disease on lower leaves and stems, root condition, nodulation, insect counts, stand counts, and the difference between two causes that look identical from above. A sensor flying over the crop sees the top of the canopy, and by the time an understory problem shows up in the map it has had time to develop.
How should imagery and boots be combined in one program?
Fly first, then walk. Produce the map, read it for shape rather than absolute numbers, choose ground-truth points from it including one strong area as a reference, walk and diagnose those points, then record what each pattern turned out to be. That last step is what makes the following season’s maps quicker to read, and it is the one most often skipped.